eFatigue gives you everything you need to perform state-of-the-art fatigue analysis over the web. Click here to learn more about eFatigue.
International Institute of Welding
Welds may be analyzed with any fatigue method, stress-life, strain-life or crack growth. Use of these methods is difficult because of the inherent uncertainties in a welded joint. For example, what is the local stress concentration factor for a weld where the local weld toe radius is not known? Similarly, what are the material properties of the heat affected zone where the crack will eventually nucleate. One way to overcome these limitations is to test welded joints rather than traditional material specimens and use this information for the safe design of a welded structure.
One of the most comprehensive sources for designing welded structures is the International Institute of Welding Recommendations for Fatigue Design of Welded Joints and Components published in 2008. It provides standard SN curves for both steel and aluminum welds.
A copy of the recomendations can be found here Recommendations for Fatigue Design of Welded Joints and Components
Weld Classifications
For purposes of evaluating fatigue, weld joints are divided into several classes. The classification of a weld joint depends on:
- the macroscopic geometry of the pieces welded,
- the direction of the cyclic stresses,
- the welding process and joint preparation,
- the inspection proceedure (NDT), and
- the location of the crack that leads to failure.
Here is an example of one of the classifications from the database.
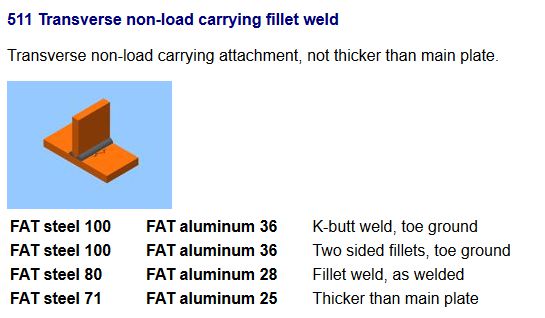
Weld classes are defined as the fatigue strength at 2x10⁶ cycles. Thus a FAT Class of 100 will have an allowable stress of 100 MPa for a life of 2x10⁶ cycles.
Fatigue Resistance Curves
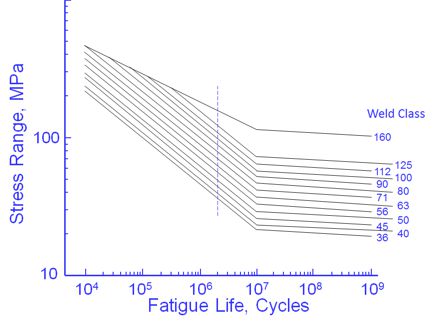
The curves shown above are valid for structural steel welds. They represent 95% probability of survival. Fatigue lives are not dependant on either the material or the applied mean stress. Welds are known to contain small cracks from the welding process. As a result, the majority of the fatigue life is spent in growing these small cracks. Fatigue lives are not dependant on material because all structural steels have about the same crack growth rate. The crack growth rate in aluminum is about ten times faster than steel and aluminum welds have much lower fatigue resistance and classification. Welding produces residual stresses at or near the yield strength of the material. The as welded condition results in the worst possible residual or mean stress and an external mean stress will not increase the weld toe stresses because of plastic deformation.
Weld class 160, for steel, represents unwelded structural steel plate. A welded structure may not have greater fatigue resistance than an unwelded plate so this represents an upper bound on the fatigue behaviour. The curves are straight lines, on a log-log scale. Below 107 cycles the slope of these lines is 3, the same slope that is found in crack growth data. A true fatigue limit does not exist in welded structures and beyond 107 cycles the slope changes to 22. This represents a reduction of 10% in stress range for each decade in life.
Thickness Effects
For the same nominal stress, thicker welded plates have lower fatigue strengths than thinner welded plates. In thicker geometrically similar plates, the stress concentration field due to the weld toe extends over a larger volume so that small microcracks that form are driven by higher stresses. Thickness effects are taken into consideration by lowering the fatigue class by a thickness reduction factor f(t).
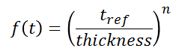
The reference thickness, tref is 25mm. When t > 25 mm a conservative value of n = 0.3 for transverse butt welds is used. This is reduced to n = 0.2 for cruciform welds when t > 25 mm.
Stress Ratio Effects
A fatigue enhancement factor f(R) may be considered by increasing the fatigue class if the residual stresses are known. This enhancement is dependant on the stress ratio, R, and the type of weld. If no reliable information on residual stress is available, an enhancement factor f(R) = 1 is recommended.
Unwelded base material, FAT Steel 160 or FAT Aluminum 71
- f(R) = 1.6, R < -1
- f(R) = -0.4R + 1.2, -1 ≤ R ≤ 0.5
- f(R) = 1, R > 0.5
Thin-walled structural elements without assembly constraints
- f(R) = 1.3, R < -1
- f(R) = -0.4R + 0.9, -1 ≤ R ≤ -0.25
- f(R) = 1, R > -0.25
Complex two and three dimensional welded components, the normal case for welded structures.
- f(R) = 1, no enhancement