- Fatigue Technologies
- Constant Amplitude
- Fatigue Calculators
- Finders
- Technical Background
- Variable Amplitude
- Finite Element Model
- Multiaxial
- Probabilistic
- High Temperature
- Welded Structures
- Cast Iron
- Small Defect √ Area
- Utilities
- Languages
 日本語
日本語SAE Keyhole Test Program
In the 1970's, The Society of Automotive Engineers (SAE) Fatigue Design & Evaluation Committee conducted a test program to provide a set of basic data for determining the validity of various fatigue life estimation and analysis methods. Three variable amplitude load histories were obtained from service strain-time histories submitted by committee members. A test program was conducted using a notched member containing many of the complexities of actual components and incorporating two steels commonly used in the ground vehicle industry. Basic material properties data were generated for both materials. In addition, constant amplitude tests were performed on the "component like" specimen to provide basic data that included processing and manufacturing effects. The variable amplitude lest program consisted of 57 individual tests using the three loading histories at several load levels.
The test program and analysis are documented in the book "Fatigue Under Complex Loading: Analysis and Experiments", Advances in Engineering, AE-6, Society of Automotive Engineers, Warrendale, PA, R.M.Wetzel Editor, 1977.
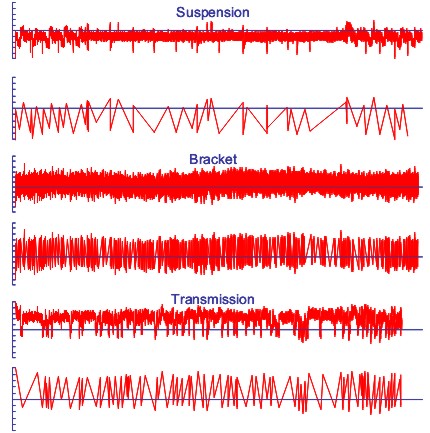
Loading Histories
Three loading histories were selected as being representative of a wide variety of actual operating conditions. These load histories selected were:
- A load history with primarily compressive mean load obtained from the bending moment on a vehicle Suspension component driven over an accelerated durability course. This history provided a mixture of random excitation with superimposed maneuver forces.
- A vibration with nearly constant mean load obtained on a mounting Bracket being excited by vehicle operation over a rough road. This vibration represents a classical case of a narrow band random vibration.
- A load history with a drastic change of a mean load obtained from the Transmission torque measured on a tractor engaged in front-end loader work.
Two versions of each history are available. The original histories which contain a few thousand data points with many smaller less damaging cycles. These smaller cycles were removed to create a mini version of each loading history. A comparison between the histories is shown below.
Each of these histories is available for analysis in eFatigue by selecting the appropriate file in the public directory. You can also download them directly in an EXCEL file format.
The loading histories are provided in a normalized format with largest load in the history scaled to 1 or -1 depending on the loading history. They can be converted into engineering units by using a scale factor in any Fatigue Analyzer.
Details of the editing process used to create the mini histories can be found here.
Test Geometry
The test specimen was designed by the committee to:
- be relatively stiff to obtain a high strain for small testing machine deflections,
- have a stress concentration factor and stress state typical of component design practice,
- have a minimum of critical machining dimensions without special surface preparation, and
- permit studies of both crack initiation and crack propagation.
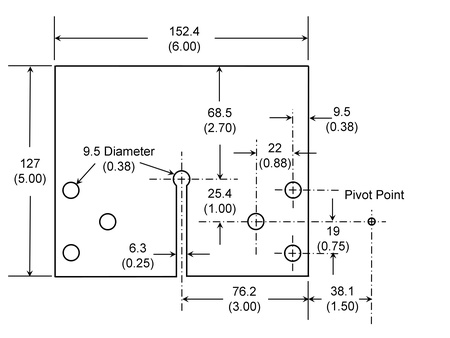
The hole was drilled and reamed with no edge preparation and was then saw cut from one side to provide the notch.
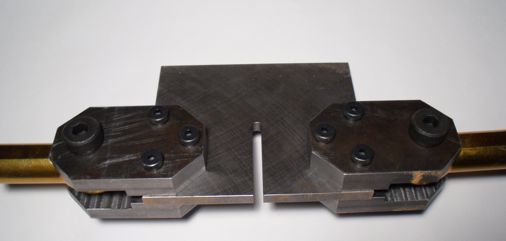
Loads were applied to the specimen/component thru a monoball fixture that allowed both tension and compression loads. A picture of the loading fixture is shown below. Loads are transferred via clamping forces to avoid failures at the bolt holes.
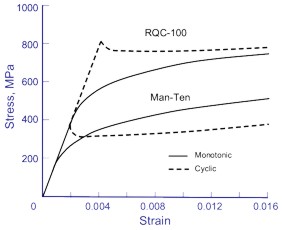
Material Properties
Two materials were selected for this test program, U.S. Steel's Man-Ten with a yield strength of 325 MPa and Bethlehem Steel's RQC-100 with a yield strength of 770 MPa. Stress strain curves for the two materials are given below.
Fatigue test data was obtained from strain controlled tests.
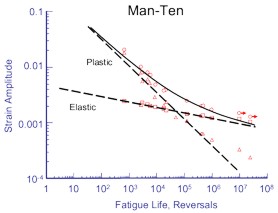
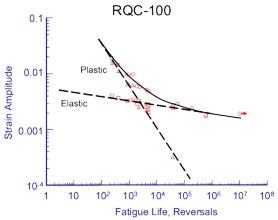
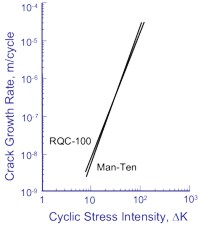
The figure below shows that the crack growth behavior of the two materials is very similar even though the traditional fatigue data above shows longer lives for the higher strength material.
Material properties commonly used in fatigue analysis are given below.
| Man-Ten | RQC-100 | |
| Elastic Modulus, E, MPa | 203 x103 | 203 x103 |
| Yield Strength, σys, MPa | 325 | 565 |
| Ultimate Strength, Su, MPa | 565 | 820 |
| Fatigue Strength Coefficient, σf', MPa | 915 | 1160 |
| Fatigue Strength Exponent, b | -0.095 | -0.075 |
| Fatigue Ductility Coefficient, εf' | 0.26 | 1.06 |
| Fatigue Ductility Exponent, c | -0.47 | -0.75 |
| Crack Growth Intercept, C, m/cycle | 3 x 10-12 | 5.2 x 10⁻¹² |
| Crack Growth Exponent, m | 3.43 | 3.25 |
Stress Analysis
Nominal stresses in the net section can be estimated by modeling the test specimen as a simple beam subjected to both tension and bending loads shown in the sketch below.
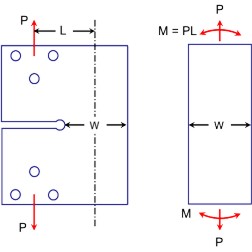
This leads to a simple expression for the nominal stress, S, as a function of the applied load, P.
S(MPa) = 11.2 P(kN) or S(ksi) = 0.00726 P(lbs)
Here the nominal stress can be considered as the outer fiber stress on a simple beam subjected to both bending and tension loads. Stress concentration effects from the hole should be added to obtain the maximum stress at the root of the notch. A stress concentration factor for a circular hole, Kt= 3 is a reasonable estimate.
Finite element models could also be used to determine the stresses. Results from ANSYS are shown below. The maximum stress computed is 32.0 MPa compared to the estimate of 33.6 MPa from the simple strength of materials calculation. This results in a more refined estimate of Kt= 2.9. An ANSYS *.rst file for a unit load of 1kN can be downloaded here SAE_keyhole.rst
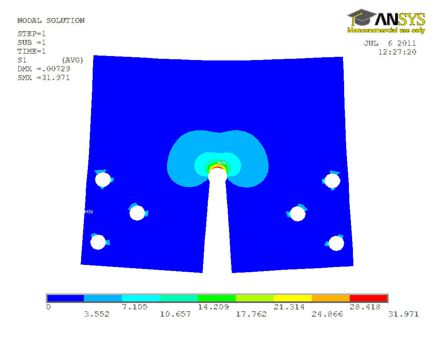
A note about modeling. This model shows the importance of modeling boundary conditions. The model above shows the force distributed to all 3 bolt holes. If all of the force is applied to a single bolt hole, the highest stress will be around the bolt not at the notch.
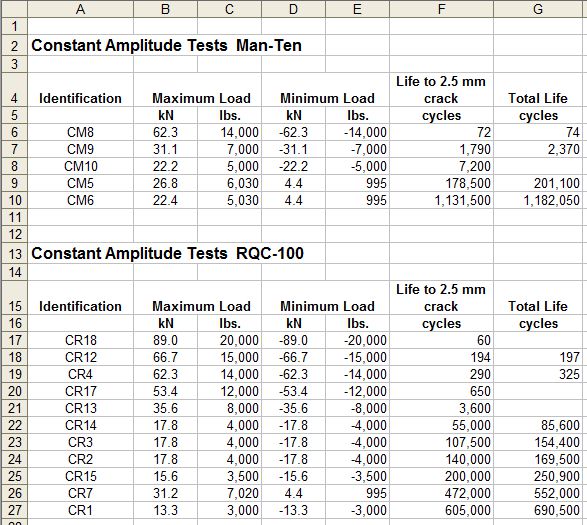
Test Results
Test results are summarized in an Excel spreadsheet. Fatigue crack initiation was arbitrarily defined as a crack 2.5 mm long in these tests. This definition results in a crack that is easily observed and is approximately the same size as the failure in a smooth material test specimen. Crack growth data ( crack length vs cycles or blocks ) is included for the tests.
The specimen designation format is loading history, material, load level and replication. For example the desigation of BR2-2 would be interperated as the bracket loading history, RQC-100 material, second load level, second test.
The Results tab gives a summary of the test condition and resultant fatigue lives. Tabs marked CM, CR etc. contain the measured crack lengths for each of the tests.
Sample Calculations
First we start with a simple stress life analysis for specimen CR1 in the table above.
Loads were converted to stresses with the simple strength of materials approximation S(MPa) = 11.2 P(kN) which results in a stress of 149 MPa for this load case. A stress concentration factor of Kt = 3 was used. The computed fatigue life is 418,000 cycles compared to the experimental life of 605,000 cycles to form a crack 2.5 mm long.
Click on this link to see the analysis: Constant Amplitude Stress Life Analysis
Strain life analysis can just as easily be conducted from the same stress inputs. The computed fatigue life is 211,000 cycles compared to the experimental life of 605,000 cycles to from a crack 2.5 mm long.
Click on this link to see the analysis: Constant Amplitude Strain Life Analysis
Crack growth analysis can also be conducted to see how the crack will grow once it is formed. The initial crack size is 32.2 mm, the length of the notch measured from the load line plus the initial crack of 2.5 mm. The computed fatigue life is 104,000 cycles compared to the experimental of 85,500 cycles.
Click on this link to see the analysis: Constant Amplitude Crack Growth Analysis
A variable amplitude strain life fatigue analysis for specimen SM2 is performed here. The loading histories can be selected from the public directory. These loading histories are scaled to have a maximum value of 1 or -1 depending on the loading history. For specimen SM2 the loading history must be scaled by 299 ( 26.7 * 11.2 ) to obtain nominal elastic stresses. The rest of the inputs are the same as constant amplitude analysis. The computed life is 2892 blocks of loading. A loading block is one repeat of the loading history. Experimental results for three tests are 1750, 2240 and 1410.
Click on this link to see the analysis: Variable Amplitude Strain Life Analysis
Next the fatigue life is computed directly from the finite element model. This model has units of MPa and mm for a unit load of 1 kN. Two scale factors, one for the maximum load and one for the minimum load are used to create a fatigue cycle. For specimen CR1 this results in scale factors of 13.3 and -13.3. The computed fatigue life is 217,100 cycles.
Click on this link to see the analysis: FEM Strain Life Analysis
Exercises
Analyze all of the load cases in the spreadsheet and make some general conclusions about the accuracy of fatigue calculations.
Using the results of the analysis, what general observations can be made about the importance of crack growth calculations as a function of the material strength and type of load history ( mean tension, zero mean and compressive mean ) ?
Compare the test results and analysis results for the full and mini loading histories. The mini histories were edited to remove less than 20% of the fatigue damage. Analyze both loading histories to determine how much fatigue damage was removed. How does this estimate compare to the experiments?
The mini loading histories appear to be nearly constant amplitude. Design a constant amplitude loading history, both load level and number of cycles, that will do as much fatigue damage as the original history.