- Fatigue Technologies
- Constant Amplitude
- Fatigue Calculators
- Finders
- Technical Background
- Variable Amplitude
- Finite Element Model
- Multiaxial
- Probabilistic
- High Temperature
- Welded Structures
- Cast Iron
- Small Defect √ Area
- Utilities
- Languages
 日本語
日本語SAE Notched Shaft Test Program
In the 1980's, The Society of Automotive Engineers (SAE) Fatigue Design & Evaluation Committee conducted an extensive testing program to develop improved evaluation techniques for determining the life of parts subjected to multiaxial stress and strain. A stepped shaft subjected to various combinations of bending and torsion was selected for the experiments. This geometry and size is similar to a wheel spindle in a ground vehicle and contains a typical stress concentration found in many industrial components. A medium carbon steel, SAE 1045, was used for these experiments.
The test program and analysis are documented in the book "Multiaxial Fatigue: Analysis and Experiments", Advances in Engineering, AE-14, Society of Automotive Engineers, Warrendale, PA, G.E. Leese and D.F. Socie Editors , 1989.
Additional test data for an induction hardened shaft can be found in "Multiaxial Fatigue of an Induction Hardened Shaft", Advances in Engineering, AE-28, Society of Automotive Engineers, Warrendale, PA, T Cordes and K Lease Editors , 1999.
Test Geometry
To encourage the exchange of data and information and to avoid the problems associated with the confidential nature associated with a specific commercial product, the committee decided to design a generic ground vehicle component. Several criteria were considered during the design phase.
- Shape: Component geometry should be similar to an actual industrial part. A large percentage of these are round shafts with geometric notches such as shoulders, keyways etc.
- Manufacturing: Induction hardening is one of the common heat treating methods used in industry. This shape would accommodate this process.
- Surface Roughness: The final surface is ground not polished since grinding is a common industrial process.
- Failure Location: Failure should occur at a predictable and consistent location for any type of multiaxial loading to facilitate crack detection and monitoring.
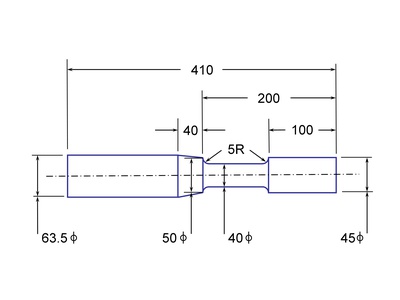
- Component Size: Although there are many advantages in testing small specimens, size effects in fatigue are particularly important. A diameter of 40mm and notch radius of 5mm are typical of industrial components and is large enough to allow strain measurements. At the same time the component is small enough so that the tests and testing equipment is affordable.
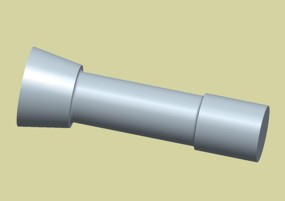
The resulting specimen/component design is shown below.
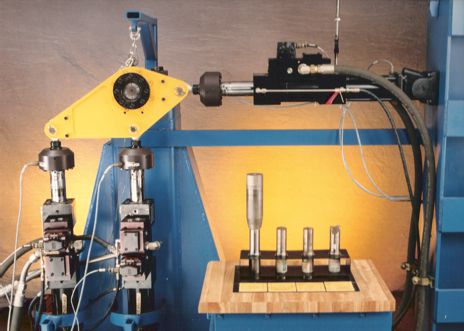
Each laboratory developed their own test fixture for applying torsion and bending loads. One such fixture is shown below. This fixture has three degrees of freedom, bending in two axis and torsion. Most of the test fixtures used for the testing had only two degrees of freedom, bending in one axis and torsion.
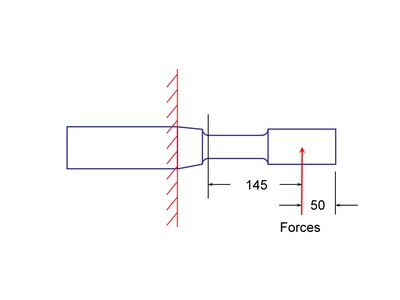
Both ends of the shaft were gripped in a collet. Boundary conditions are illustrated in the figure below. The torsion moment is constant throughout the section and the bending moment varies linearly along the test section. Bending moments reported in the test results section were computed at the root of the 5 mm radius where the failures occurred.
Loading Histories
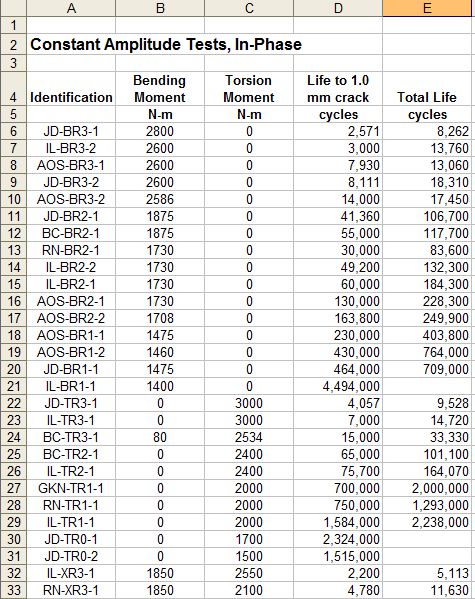
Constant amplitude tests on the shaft specimen are presented first.
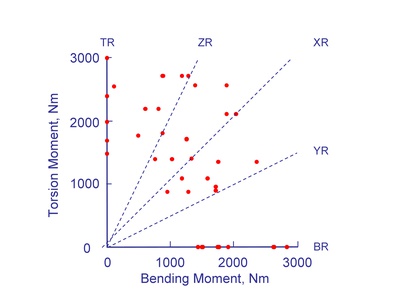
Combinations of tension and torsion loading that were used for the tests are shown below. Loads are reported in terms of amplitude and all tests were conducted with a load ratio R = -1 (zero mean). For identification purposes tests were grouped into 5 classifications depending on the nominal stresses: TR - torsion , BR - bending , XR - torsion = bending , YR - torsion = 0.5 bending and ZR - torsion = 2 bending .
A single variable amplitude amplitude loading history, Tractor Bending was used for all of the shaft tests. This history contains 616,210 data points and it appears to be nearly constant amplitude in the plot becaause of the large number of points.
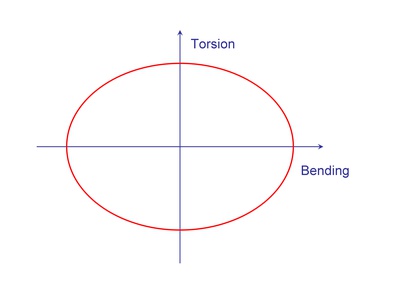
A series of 90 degree out-of-phase tests was also conducted. This type of loading is shown below and is produced by 90° out-of-phase sine waves for the torsion and bending loads. The loading history plots as an ellipse with the ellipticity depending on the ratio of the torsion and bending loads.
Material Properties
Material properties commonly used in fatigue analysis are given below.
| SAE 1045 Normalized BHN = 153 | |
| Elastic Modulus, E, MPa | 204 x103 |
| Yield Strength, σys, MPa | 380 |
| Ultimate Strength, Su, MPa | 620 |
| Fatigue Strength Coefficient, σf', MPa | 948 |
| Fatigue Strength Exponent, b | -0.092 |
| Fatigue Ductility Coefficient, εf' | 0.260 |
| Fatigue Ductility Exponent, c | -0.445 |
| Crack Growth Intercept, C, m/cycle | 8.2 x 10⁻¹³ |
| Crack Growth Exponent, m | 3.5 |
Stress Analysis
Nominal stresses can be obtained from simple strength of materials calculations with the following results for d = 40 mm.
Bending Stress:
Shear Stress:
Stress concentration factors can be obtained from the Stress Concentration Finder in eFatigue.
For a round shaft with a single fillet with dimensions D = 50 mm , d = 40 mm and r = 5mm
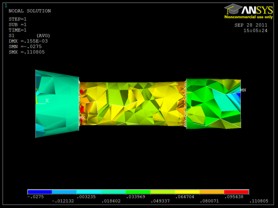
An ANSYS rst file of the shaft subject to bending and torsion loads is available for downloading. The model was loaded in either 1 N.m of torsion or bending.
An igs file of the shaft is also available for downloading.
Test Results
Test results for 62 constant amplitude tests are summarized in an Excel spreadsheet. Fatigue crack initiation was arbitrarily defined as a crack 1.0 mm long in these tests. The first part of the specimen ID is the laboratory that conducted the tests, followed by the type of loading ( TR , BR etc ) and load level. The final part of the specimen ID is used to indicate replications of the same test. The spreadsheet also contains results for 21 variable amplitude tests of the shaft with the tractor bending history. There are also 10 90° out-of-phase loading test results.
Sample Calculations
Here we choose specimen JD-BR2-1 for analysis. This is a simple bending test and a constant amplitude uniaxial analysis may be used for the assessment. Since the lives are in the midlife range, a strain-life analysis is needed to account for plasticity around the stress concentration. Loads were converted to stresses with the simple strength of materials approximation S(MPa) = 0.159 MB(Nm) which results in a stress of 298 MPa for this load case. Choose units of MPa(elastic) because the stress was computed from elastic assumptions. The stress concentration factor for bending is Kt = 1.6. Be careful, SAE 1045 steel is a heat treatable alloy and there are many material property datasets available in eFatigue depending on the material hardness. The specimens were in the normalized condition. The computed fatigue life is 36,400 cycles compared to the experimental life of 41,360 and 55,000 cycles to form a crack 1.0 mm long.
Click on this link to see the analysis: Constant Amplitude Strain Life Analysis
The Multiaxial Fatigue Calculator could also be used to analyze this load case. Multiaxial calculations do not use stress concentration factors because they are not the same in all directions. Instead the stresses at the maximum stress location are input. The maximum bending stress is SNominal * KT Bending = 477 MPa. Choose units of MPa(elastic) because the stress was computed from elastic assumptions. A range of fatigue life estimates is given depending on the multiaxial fatigue theory employed. Here it ranges from 9,000 to 22,000. For comparison the uniaxial analysis above was performed with the SWT theory which has a life of 33,630.
Click on this link to see the analysis: Multiaxial Strain Life Analysis
The Multiaxial Fatigue Calculator could also be used to analyze any of the load cases in the spreadsheet. Next we select a torsion load case, BC-TR2-1, with a torque of 2400 Nm. This results in a nominal shear stress of 192 MPa and a maximum shear stress of 192 * 1.3 = 248 MPa. Computed lives range from 29,800 to 424,000 compared to the experiment of 65,000 cycles. Why such a large difference in estimates. The longest life comes from the SWT theory which is maximum principle strain based. You should always use a shear based theory for ductile materials.
Click on this link to see the analysis: Multiaxial Strain Life Analysis
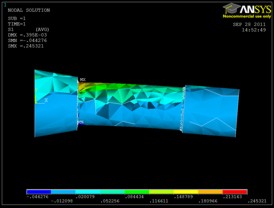
Fatigue lives can also be computed directly from the ANSYS model with the FEM Analyzers. Since the tests involve plastic deformation it is best to use the FEM Strain-Life Analyzer. We choose AOS-BR1-1 as an example. Select the bending FEM model for a unit load of 1 Nm in bending. Then scale the FEM to +/- 1475. Be sure to choose the normalized condition for the 1045 steel. You can see the effect of strain gradients by turningthe gradient effects on or off. Results are shown as a series of contour plots of fatigue life. In this case the life is computed to be 360,000 cycles compared to the experiments of 230,000 and 464,000.
Click on this link to see the analysis: FEM Strain Life Analysis
Exercises
Analyze all of the load cases in the spreadsheet and make some general conclusions about the accuracy of fatigue calculations.
From the experimental data, what general observations can be made about the importance of crack growth calculations?