- Fatigue Technologies
- Constant Amplitude
- Variable Amplitude
- Finite Element Model
- Multiaxial
- Probabilistic
- High Temperature
- Fatigue Analyzers
- Finders
- Technical Background
- Welded Structures
- Cast Iron
- Small Defect √ Area
- Utilities
- Languages
 日本語
日本語eFatigue gives you everything you need to perform state-of-the-art fatigue analysis over the web. Click here to learn more about eFatigue.
Thermal Mechanical Technical Background
Thermal mechanical fatigue (TMF) is caused by combined thermal and mechanical loading where both the stresses and temperatures vary with time. This type of loading can be more damaging by more than an order of magnitude compared with isothermal fatigue at the maximum operating temperature. Material properties, mechanical strain range, strain rate, temperature, and the phasing between temperature and mechanical strain all play a role in the type of damage formed in the material. These types of loadings are most frequently found in start-up and shut-down cycles of high temperature components and equipment. Typically, design lives are a few thousand cycles and involve significant plastic strains.
One of the major differences between isothermal and thermal mechanical fatigue is constraint. When heated, structures develop thermal gradients as they expand. Expansion near stress concentrators is often constrained by the surrounding cooler material. In this case thermal strain is converted into mechanical strain which causes fatigue damage in the structure. Total constraint exists when all of the thermal strain is converted into mechanical strain. Over constrain can occur in a stress concentration where the mechanical strain is greater than the thermal strain. One measure of the degree of constraint is the ratio of the thermal and mechanical strain rates.
TMF loading is often described to be in-phase (IP) or out-of-phase (OP). A schematic illustration of the stress-strain response under these two loadings is given in Figure 1. In IP loading, the maximum temperature and strain occur at the same time. In OP loading, the material experiences compression at highest temperature and tension at lower temperatures. OP loading is more likely to cause oxidation damage because an oxide film can form in compression at the higher temperature and then rupture during the subsequent low temperature tensile portion of the loading cycle where the oxide film is more brittle.
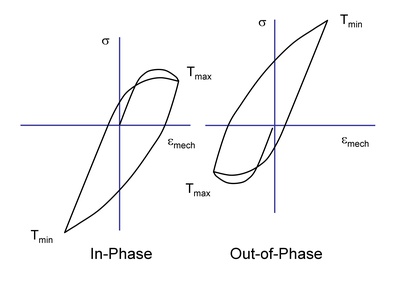
Figure 1 Load and Temperature Phasing
Figure 2 shows early TMF test data from Jaske (Jaske, C.E., Thermal Fatigue of Materials and Components, ASTM STP 612, 1976, pp. 170-198) for a low carbon steel. Isothermal fatigue tests at various temperatures are shown as the lines without symbols. TMF OP tests are shown with the solid symbols in the figure. Fatigue lives for tests conducted with variable strains and temperatures between 93 °C and 538 °C are more than an order of magnitude shorter than tests conducted at a constant temperature of 538 °C. Assuming the "worst case" isothermal material properties is very non-conservative and a TMF fatigue analysis must be employed for TMF assessments.
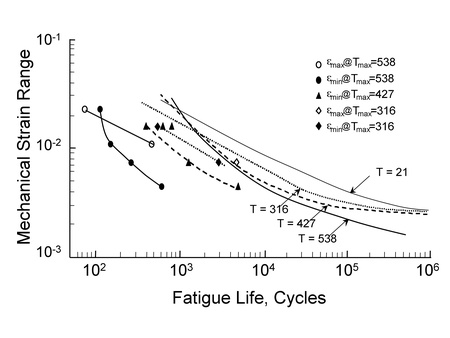
Figure 2 TMF Test Results for 1010 Steel
There are many active mechanisms in the TMF process. For discussion, it is convenient to consider damage from three primary sources: fatigue, oxidation and creep (Sehitoglu, H., Advances in Fatigue Lifetime Predictive Techniques, ASTM STP 1122, 1992, pp. 47-76). Damage from each process is summed to obtain an estimate of the total fatigue life, Nf.
Frequently one of the damage mechanisms is dominant. From a modeling prospective, this suggests that the individual damage models and their associated material properties must be accurate only for those conditions where the life is dominated by that failure mechanism.
Fatigue Mechanisms
Fatigue damage in the life regime of interest in TMF is in the form of nucleation and growth of microcracks. The left side of Figure 3 shows an example of the surface damage observed at higher plastic strains (Stolarz, J., Ecole Nationale Superieure des Mines, Presented at LCF 5 in Berlin, 2003). Microcrack density will decrease at lower strain levels. The right side of Figure 3 shows the cross section view where many microcracks nucleate on the surface but only a few of them are able to penetrate into the bulk of the material.
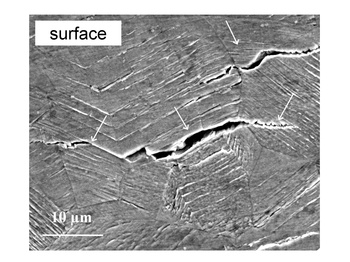
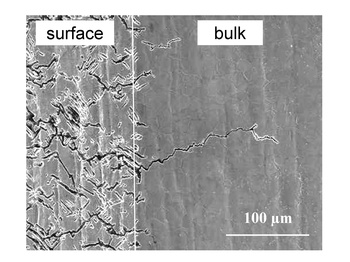
Figure 3 Formation of Surface Cracks in 20-25 Austenitic Steel
The process is driven by cyclic plastic strains where oxidation and creep effects are negligible. Fatigue damage will dominate at high strain ranges, strain rates and low temperatures.
Oxidation Mechanisms
Oxidation damage can occur in the form of an oxide intrusion such as the one shown in Figure 4. In OP loading, an oxide layer can form on the surface when the material is hot and in compression. At the lower temperature the oxide layer becomes brittle. During mechanical straining it then cracks to expose new clean metal surfaces. This clean metal will rapidly oxidize and the process repeats during the next mechanical strain cycle. Ultimately, this will form a crack which can then grow during the mechanical strain cycle. Oxide cracks can also form during IP loading. In this case, the oxide forms during the hot portion of the loading cycle while the material is in tension. Then upon cooling the oxide film undergoes a buckling delamination which fractures the oxide and exposes clean metal surfaces. Oxide formation and rupture during isothermal loading is not the dominant failure mechanism and is not reflected in isothermal test or materials data. Oxide formation will occur easier and faster at higer temperatures. The tendency of the oxide to develop microcracks will depend on the cyclic strain range; stress does not play a role in the development of oxide induced microcracks.
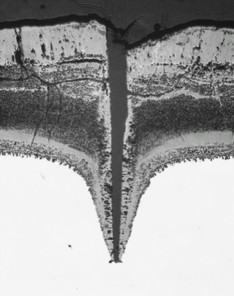
Figure 4 Oxidation Damage in Steel
Creep Mechanisms
Creep is essentially a diffusion process. At high stresses diffusion allows dislocations to climb over barriers. At lower stresses diffusion occurs along the grain boundaries. Figure 5 shows a triple point crack that has formed at the junction between grains. These microcracks form as a result of grain boundary sliding to accommodate the change in shape of elongated grains. Diffusion is highly temperature and time dependant. Maximum stress rather than strain range has a dominant role in the formation of these microcracks. The interaction of the strain rate and temperature has a strong influence of the stresses that are observed during cyclic loading.
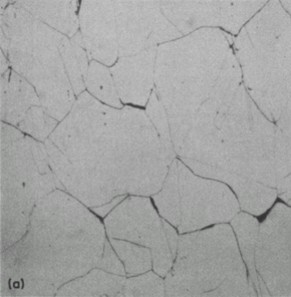
Figure 5 Wedge crack nucleation in Type 316 stainless steel
One common feature of all these
mechanisms is that they involve the nucleation and early growth of microcracks.
There will also be interactions between the mechanisms as well. for
modeling, individual components are considered and interactions are
ignored. This notation is employed in the following equations: cr -
creep, in - inelastic, mech - mechanical, ox - oxidation, and th -
thermal. The traditional nomenclature is employed for stress, σ ,
strain, ε , strain rate,  , temperature, T, and life, N.
Fatigue Damage Model
Conventional low cycle fatigue damage is a surface phenomena where small microcracks nucleate and grow on the surface of the material. Bulk stresses and strains are employed to describe fatigue damage because the microcracks growth is too complex to describe in detail. The strain-life equation is the most common description of the process.
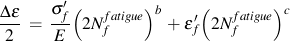
σf' fatigue strength coefficient
b fatigue strength exponent
εf' fatigue ductility coefficient
c fatigue ductility exponent
E elastic modulus
Oxidation Damage Model
The oxidation damage formulation of Neu and Sehitoglu (Neu, R.W. and Sehitoglu, H., Metallurgical Transactions A, Vol. 20A, 1989, pp. 1769-1783) is employed in this study. Oxide damage will occur when the strain range exceeds a threshold for oxide cracking.
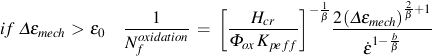
εo threshold strain for oxide cracking
Hcr constant related to critical oxide thickness
β mechanical strain range exponent
b thermal strain rate sensitivity exponent
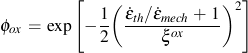
ξox oxidation phasing constant for thermal and mechanical strains
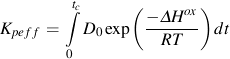
ΔHox activation energy for oxidation
Do scaling constant for oxidation
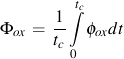
Oxidation damage is a function of the strain range, strain rate, and temperature. A phasing factor ξox is introduced to account for the type of oxide cracking that can occur in either IP or OP loading. Phasing is represented by the ratio of thermal and mechanical strain rates. Oxidation rate is determined by the effective parabolic oxidation constant, Kpeff.
Creep Damage Model
The creep damage formulation suggested by Neu and Sehitoglu is also employed in this study.
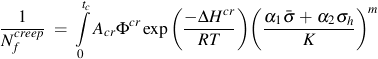
ΔHcr activation energy for creep
Acr scaling constant for creep
m creep stress exponent
α1 stress state constant
α2 hydrostatic stress sensitivity constant
ξcr creep phasing constant for thermal and mechanical strains
Creep damage is a function of the stresses, time and temperature. Microstructural creep damage differs in tension and compression. It is commonly assumed that microcracks do not form and grow in compression. If no creep damage occurs in compression α1 = 1/3 and α2 = 1. Here, K is the drag stress which will be defined in the next section. A phasing factor fcr is also introduced to account for different creep damage mechanisms such as intergranular or transgranular cracking.
Constitutive Equation Model
A unified constitutive model first suggested by Bodner and Partom (Bodner, S.R. and Y. Partom, J. of Applied Mechanics, Vol. 46, 1979, pp. 805-810) is employed to compute the stresses. The combined effects of both creep and plasticity are treated as inelastic strains. At lower stresses, time dependant creep dominates the behavior. Plasticity dominates at higher stresses. A drag stress, K, is introduced into the formulation. The drag stress is an internal state variable that is related to the strength of the material. It is the stress that defines the transition from creep to plasticity dominated deformation. It is not constant but depends on the temperature.
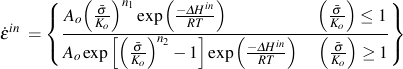
ΔHin activation energy for inelastic deformation
Ao scaling constant for inelastic deformation
n1 exponent for creep dominated deformation
n2 exponent for plasticity dominated deformation
A linear temperature for the drag stress is often employed. Other forms are possible.
K = K0 - K1T
K0 Back stress
K1 Back stress temperature dependence
A linear temperature dependence for the elastic modulus is also frequently employed.
E = E0 - E1T
E0 elastic modulus
E1 elastic modulus temperature dependence
The thermal expansion coefficient is also needed in the analysis to determine thermal strains.
α thermal expansion coefficient
These TMF equations represent a model for steady state deformation and require a total of 27 material modeling constants.
Simplified Material Properties
TMF mechanisms are complicated and influenced by the material microstructure, environment and external loading and a complete set of material data is preferred. Twenty seven material modeling constants means that only a few materials have been fully characterized. Yet, life assessments must frequently be made in the early stages of design before a complete set of materials data is available. As a result, there is a need to make estimates of the material properties from other more readily available data. In this paper, simplified material properties are employed. They are based on a classification system, low carbon steels, alloy steels, aluminum, etc. because a complete set of data is available for only a few materials. These materials will be designed as reference materials. Properties from these materials will be modified to account for microstructural differences between materials within a given class. Fatigue constants are always needed for the analysis.
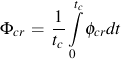
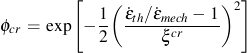
Both creep and oxidation damage models have a phasing factor. The phasing factor is shown in Figure 6 as a function of the thermal and mechanical strain ratio. This factor determines the dominant failure mechanism, creep or oxidation. As a general rule creep will dominate in-phase TMF loading. Oxidation will dominate for both isothermal and out-of-phase TMF. It should be noted that many TMF problems involved constrained heating and cooling which result in out-of-phase loading. In this case, knowledge of the creep properties is unnecessary because only the oxidation and fatigue behavior is important.
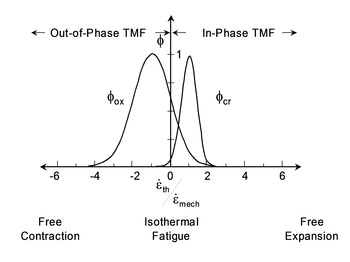
Figure 6 Phasing Constants for Oxidation and Creep
Fatigue Constants
Many correlations between fatigue and tensile properties have been proposed. Many of them have been validated only for steels. Muralidharan and Manson's method (Muralidharan, U. and S.S. Manson, J. Engineering Materials and Technology, Vol. 110, 1988, pp. 55-58) has been validated for a wide range of materials. It is based on the elastic modulus, E, ultimate strength, Su, and true fracture strain, ef.

Oxidation Constants
Oxidation is dominated by the matrix material rather than microstructure in most alloys. As a first approximation, alloys of a similar matrix are expected to have the same oxidation behavior. No adjustments are needed for microstructure and all materials of the same class will have the same behavior.
Creep Constants
Creep is a process that is driven by diffusion either in the bulk material or along the grain boundaries. Creep damage should be directly related to the creep rate and rupture life. Equation 7 for creep damage can be divided into two terms, one for temperature and one for stress dependence. Figure 7 shows a Larson-Miller plot for various alloys. Two materials with the same value of the Larson-Miller parameter, PLM, will have the same time and temperature dependence. Note that the lines describing the material behavior are nearly parallel for a given class of materials. For example, the difference between low carbon and Cr-Mo steel is essentially a shift in stress level. This observation allows us to estimate the behavior of other materials in the same class. the activation energy for creep, ΔHcr, is directly related to the self-diffusion activation energy which will depend on the matrix material not the microstructure. The stress constants, α1 and %alpha;2, and the phasing constant, ξcr, can also be considered functions of the matrix material and as a first approximation will not change with the microstructure. Exponents such as m are an indication of the mechanism and are not expected to change. This leaves a single constant, Acr, that will depend on the microstructure. As a first approximation, this constant can be scaled from the reference material data. Two materials with the same PLM will have the same creep damage so that the integrand of creep damage must also be the same for both materials. In Figure 7, consider low carbon and C-Mo steel. The allowable stresses for C-Mo steel are shifted up by about 25%. Let the creep strength be denoted as S and the creep strength of the reference material as S|ref. Manipulating the equation for creep damage and eliminating the temperature terms results in an approximate expression for the constant Acr.
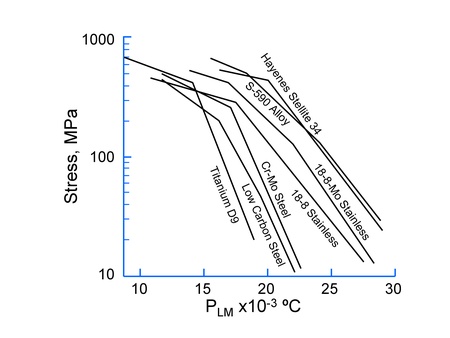
Figure 7 Larson Miller Parameters
Microstructural effects are indirectly included in the creep damage formulation by normalizing the stress by the drag stress K. Drag stress will also be directly related to the materials creep strength since the drag stress represents the transition between creep and plasticity dominated behavior. The creep constant can be further simplified to Acr = Acr|ref with the final result that no adjustments are needed for the creep constants. Differences between materials within a class are modeled by changes in the drag stress.
Constitutive Equation Constants
Stresses are not included in the fatigue and oxidation models, only the creep damage model. In the unified constitutive models no attempt is made to separate the creep and plasticity strains, they are all considered as inelastic strains. The exponential terms are related to high temperature creep deformation. Following the same arguments used for determining creep damage constants, the activation energy and exponents are expected to be a constant for alloys within a class of materials. The remaining two constants Ao and K will depend on the material microstructure. Drag stress should scale directly with the materials strength, either creep strength or yield strength. The constant Ao is assumed to remain constant.
A very simple model for approximating TMF material constants is proposed, simply adjust the material drag stress in proportion to the material strength. Creep strength is preferred but room temperature yield strength could be employed when creep data is not available.
Comparison With Experiments
Two of the datasets analyzed are presented here. The basis of comparison is the computed TMF lives because our objective is to make estimates of fatigue lives not reproduce material modeling parameters. The first dataset analyzed is that shown in Figure 2 for 1010 steel. The reference data employed was 1070 steel. Creep strength data was not available for both materials so the yield strength was used. Fatigue constants were obtained from the SAE handbook for 1010 steel Yield strengths for 1010 and 1070 steel were obtained from www.matweb.com. It lists the yield strengths as 300 and 580 MPa for 1010 and 1070 steel respectively. Before performing the calculations the drag stress constants were reduced by a factor of 0.52. No other changes in the oxidation, creep or constitutive equation constants were made. Results of the analysis are given in Table 1. In addition to the experimental and calculated fatigue lives, the relative contribution of each of the three damage mechanisms is given.
Table 1 1010 Steel Results from Jaske
|
Mechanical Strain Range |
Tmax |
Experiment cycles |
Analysis Cycles |
Fatigue Damage |
Oxidation Damage |
Creep Damage |
|
|
OP |
0.0200 | 538 | 116 | 427 | 60% | 40% | - |
| 0.0100 | 538 | 157 | 1850 | 51% | 49% | - | |
| 0.0068 | 538 | 262 | 4290 | 43% | 57% | - | |
| 0.0041 | 538 | 632 | 13400 | 30% | 70% | - | |
| 0.0148 | 427 | 600 | 1330 | 94% | 6% | - | |
| 0.0071 | 427 | 1307 | 8350 | 90% | 10% | - | |
| 0.0040 | 427 |
4890 |
40200 | 83% | 17% | - | |
| 0.0143 | 316 | 569 | 1530 | 99% | 1% | - | |
| 0.0070 | 316 | 3232 | 9240 | 99% | 1% | - | |
| IP | 0.0200 | 538 | 75 | 386 | 55% | 32% | 13% |
| 0.0100 | 538 | 489 | 836 | 23% | 18% | 59% | |
| 0.0070 | 427 | 3282 | 7870 | 85% | 8% | 7% | |
| 0.0072 | 317 | 4778 | 8570 | 100% | - | - |
A second set of test data for a Ni based superalloy IN 738 LC was also analyzed. The reference material selected was another Ni based superalloy Mar M247. Creep strength of IN738 was taken from High Temperature High Strength Nickel Base Alloys, International Nickel Company, 3rd Edition, 1977 as 210 MPa at 870 C. Similar data for Mar M247 was obtained from Superalloys - A Technical Guide, ASM International, 2nd Edition, 2002 as 280 MPa. Again the drag stress constants for Mar M247 were reduced by 0.75 to obtain an estimate of the IN 738 constants. No other adjustments were made to the Mar M247 oxidation, creep or constitutive equation constants were made. Strain life data was taken from Materials Science and Technology, Vol. 17, 2001, pp. 1087-1091. Results of the analysis are shown in Table 2.
Table 2 IN 738LC results from Fleury and Ha
| Mechanical Strain Range | Experiment Cycles | Analysis Cycles | Fatigue Damage | Oxidation Damage | Creep Damage | |
| OP | 0.008 | 100 | 182 | 9% | 91% | - |
| 0.004 | 4000 | 1620 | 1% | 99% | - | |
| IP | 0.0075 | 180 | 77 | 3% | - | 97% |
| 0.005 | 1000 | 837 | 2% | - | 98% | |
| 0.004 | 2000 | 2490 | 1% | - | 99% |
Results in Tables 1 and 2 show that the simple approximate method can be expected to produce fatigue lives that are within an order of magnitude of the experimental lives.